local variable type inference with instance and static initializers

Local type variable inference is the formal name of “var” in Java. From the name, you might deduce some things about allowed or disallowed locations. For example, a local variable in a method is allowed and an instance variable declaration is not.

Scopes that are even more granular are also allowed such as inside a for loop or try with resources statement.

I learned today that instance and static initializers are allowed as well.

public class LVTI {
public int myValue;
{
var temp = 3;
myValue = temp;
}
}
}

In hindsight, this makes sense. An initializer is a block of code. Which can have local variables.

For more on local variable type inference, please see the official style guidelines.

Jeanne is a Java Champion!

On Tuesday 6/23//19, I became a Java Champion. If you aren’t familiar, there’s a good overview of the program. To me, it’s an amazing peer recognition award! As of right now, there are 287 Java Champions. (Andres Almiray maintains a list of Java Champions)

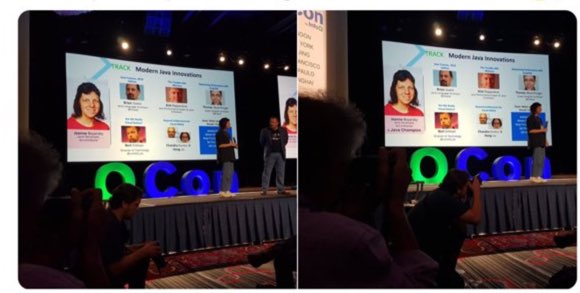
One of my friends took video of the announcement. It was fun. I was the track lead of the Modern Java Innovation track. When I got up to explain the track, Wes (the MC) said there was a mistake on the slide. He then explained the Java Champion program and announced me as one.

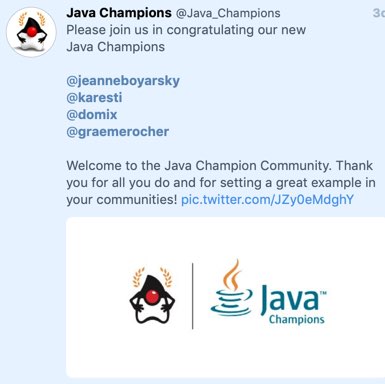
Shortly after that came the official tweet

You might be wondering what I did to become a Java Champion. Many things including speaking, writing, volunteering with a robotics team, community contributions like CodeRanch and more.

A year ago at conferences, I started getting asked if I was a Java Champion. I was not, but it motivated to organize my accomplishments. I stood up a Google site to list what I’m most proud of: http://jeanneboyarsky.com/. Time to add Java Champion to that list! (and yes, I know how to make a website; I choose google site so I could focus on content)

[QCon 2019] The Trouble With Memory

Kirk Pepperdine

For other QCon blog posts, see QCon live blog table of contents

General

  • Slow database queries, inefficient app code and too many database queries are most reported problems
  • Once drill down, over 70% of all Java apps are bottlenecked on memory churn. It’s not reported because hard to observe
  • Tend to put logging around past problems.
  • If apply instrument to a system, it will always tell you something. And then you act on it
  • Cheapar to predict than react

Common libraries

  • Logback
  • Marshalling Json, SQL
  • Caching products
  • Hibernate

Memory

  • Java heap has generations
  • Hopefully people have moved to G1GC
  • Everything happens in the free list

Problems

  • Large number of temporary objects quickly fills Eden
  • Causes frequent young cycles. Causes premature promotion which means will go to tenured too early
  • Heap becomes more fragment
  • Allocation is quick. No cost to collect if objects die quickly. However, still slow if you do something quick enough times.
  • Large live data set size. Data consistently live in your heap. Increases time to copy/compact. Likely have less space to copy to. Think about Windows defragmenter. [Do people still have to do that?]
  • Memory leak from unstable live data. JVM will terminate if you are lucky.
  • Out of memory – 98% of recent time spent in GC with less than 2% of heap recovered. If don’t meet that criteria, app is just really slow, but don’t get the out of memory error.

Escape analysis

  • Test applied to a piece of data. What is the visibility/scope.
  • If scoped locally, only thread that created it can see it.
  • If passed to method, partial escape.
  • If data scoped so multiple threads can see it (Ex: static), full escape.

Demo

  • Showed GC log. Want to see low pause times
  • Showed allocation rates. Problem if too high
  • In Visual VM, looked at profiler. Check filters to ensure not filtering the bottleneck out of your profile
  • Sort by # allocated objects to see frequency. It doesn’t take longer to allocate a large object than a small one.
  • Take a snapshot and look at trace
  • “Stop thinking” – explore what is shown without assuming
  • Time to look at the code from the stack trace that is creating all the objects
  • Escape analysis code
  • Run jitwatch to see allocations. Can see if direct/inline allocation. Can see when bytecode eliminates an allocation
  • Profiler is lying to you.
  • Performance differs in test vs prod environment

Q&A

  • How know the performance problem is the int[] in the demo? Went through profiler to show stack trace. Used BigInteger which uses up a lot more memory than a long
  • Absolute number for GC allocation rate? Sparc? Number seem to hold regardless of hardware. Should focus on the CPU going forward.
  • <missed question> – try to find mutable state that is not shared

My impression

This was great. I learned a lot and it kept my attention. I really liked the demo.